Planned Feature: Stats
Stats is planned as a readable summary of glucose patterns across multiple days of xDrip+ or Nightscout data.
It should help users understand whether their glucose control is improving, stable, or getting harder to manage.
Planned purpose
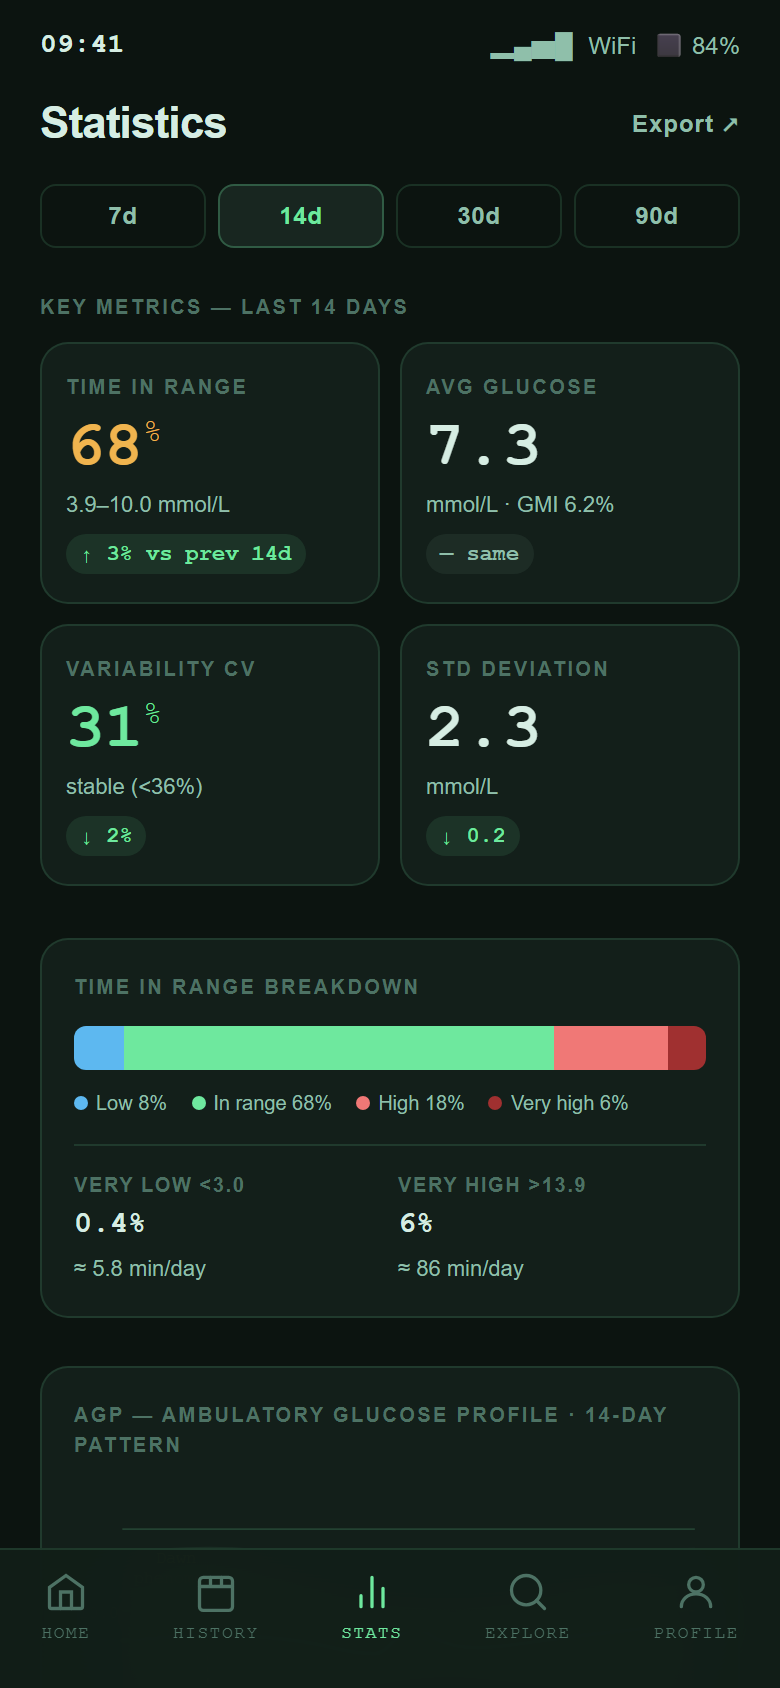
The Stats screen would summarize:
- Time in Range
- Average glucose
- Coefficient of Variation
- Standard deviation
- Range breakdown
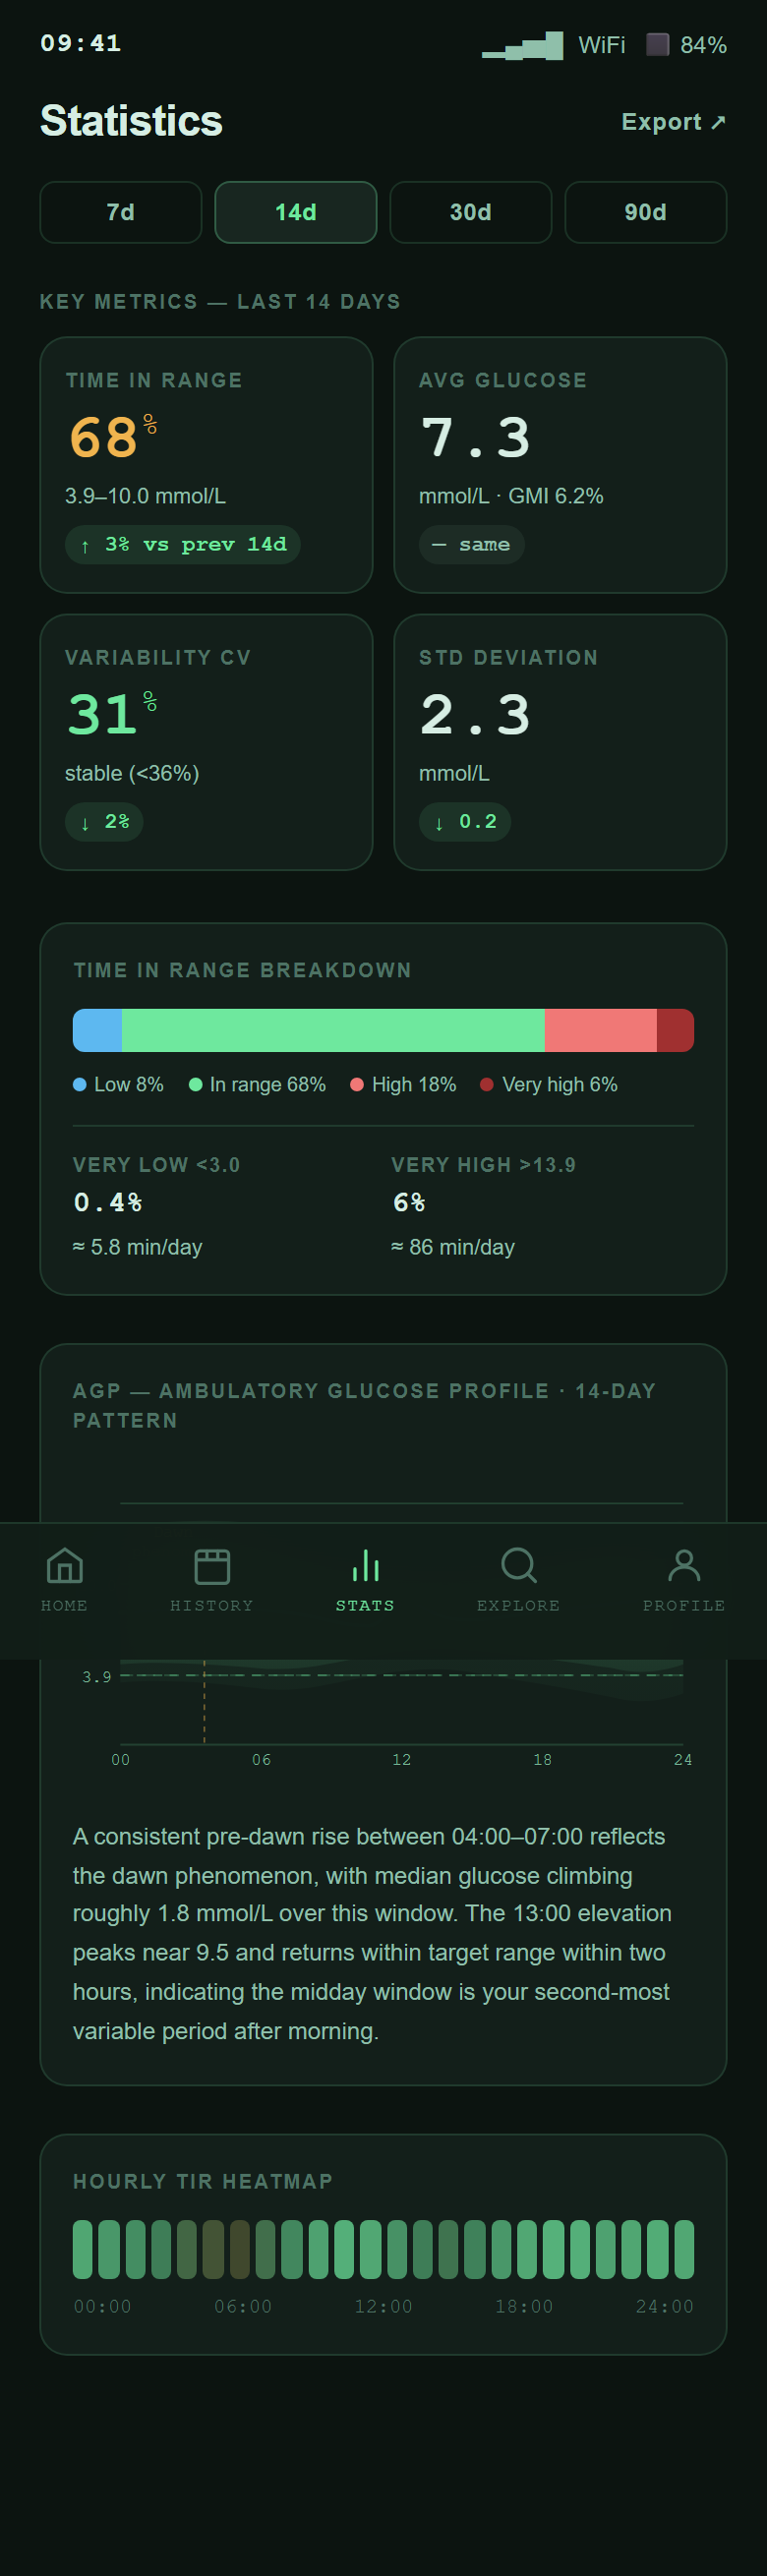
- AGP-style daily pattern
- Hourly Time in Range heatmap
The goal is to present common CGM metrics for everyday review, not to create a clinical dashboard or replace views users already trust.
Full-screen preview
Feedback needed
Useful feedback for this screen:
- Are TIR, average, CV, and SD the right headline metrics?
- Should AGP be included in the first release or later?
- Is the heatmap understandable for non-technical users?
- Which time windows matter most: 7 days, 14 days, 30 days, or 90 days?
- What statistics are useful without turning the app into a clinical dashboard?